
# System/ Services Information
This section covers information about System and Services.
# Accessing System Services
To access system services, sign into the control panel and then click on the "Admin Tools" icon, followed by the "Show Services" link.

# System/Services Information
You will see a page that looks like this:
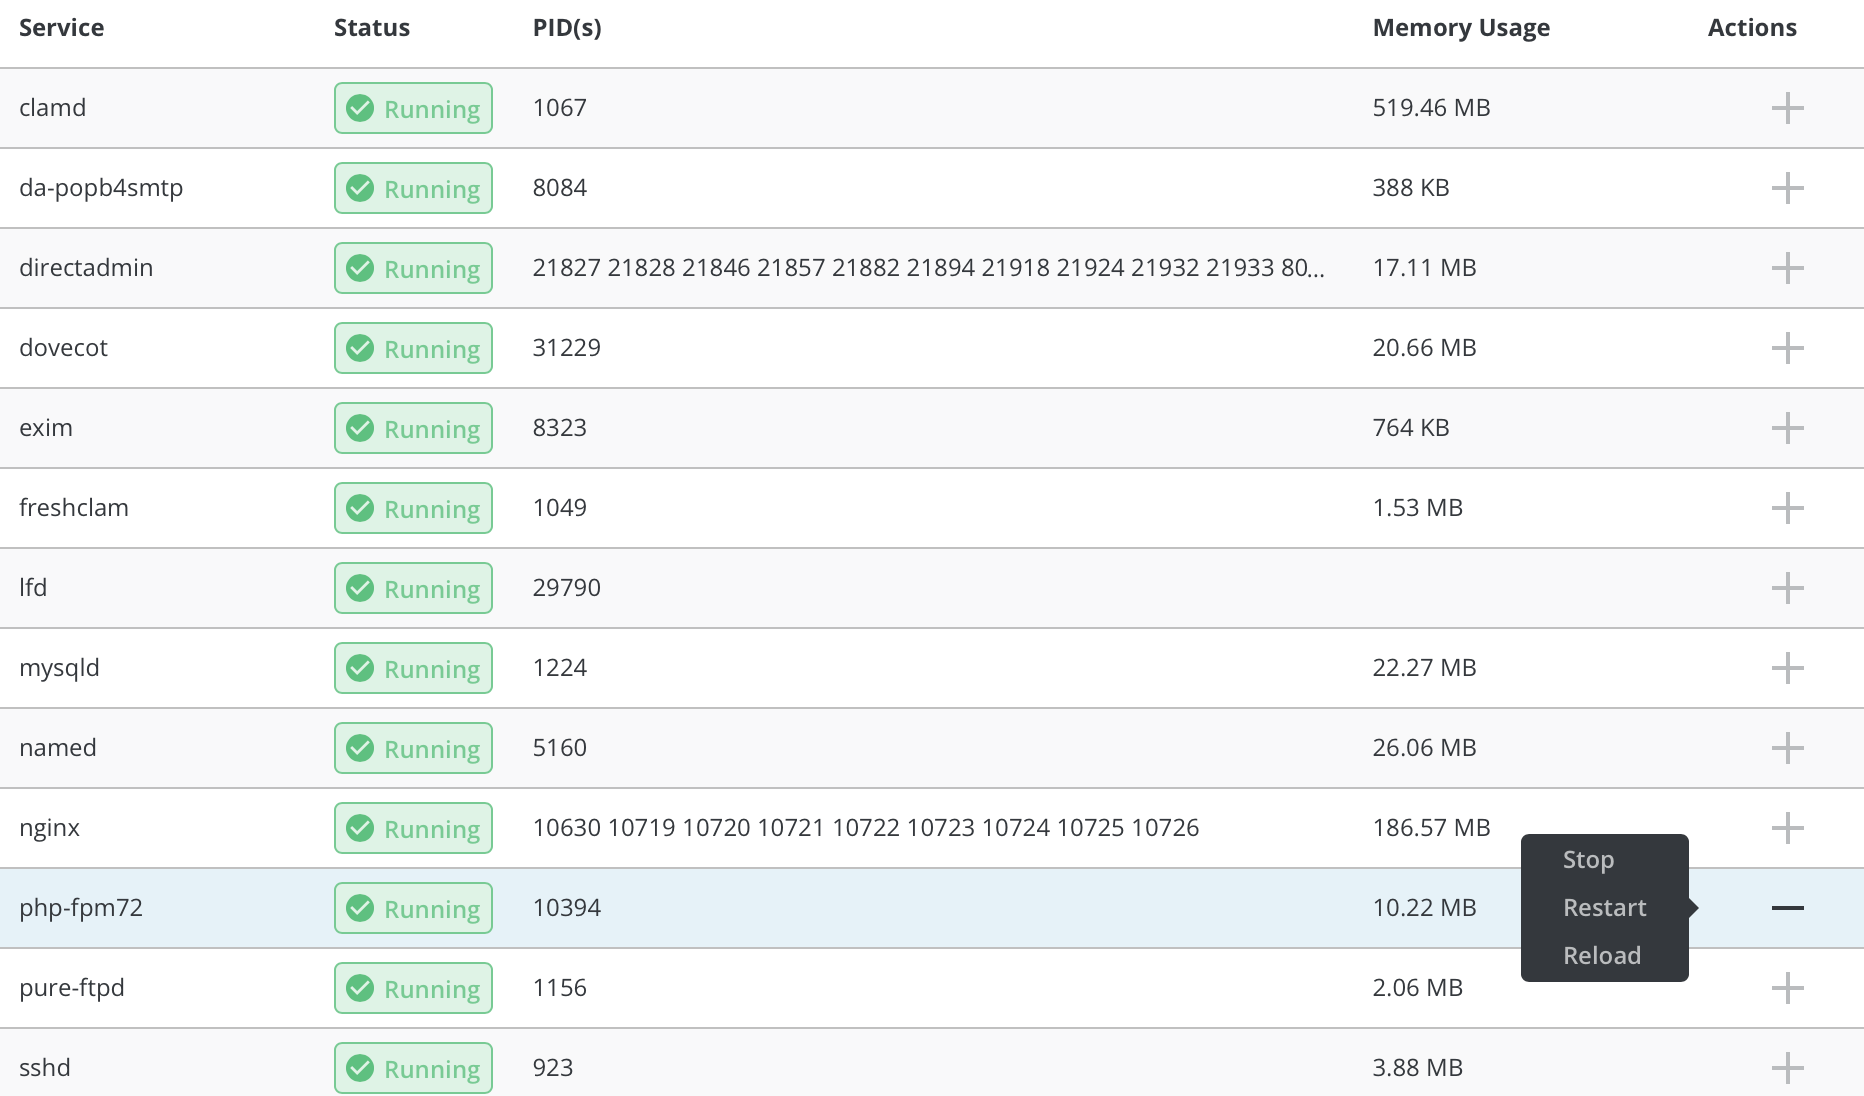
The services table provides you with:
- The process IDs of the services
- The status of the services (running/stopped)
- The ability to start a service
- The ability to stop a service
- The ability to restart a service
- The ability to reload a service
To start, stop, restart, or reload a service, click on the Actions "+" button and select desired link.
Warning: Stopping certain services (such as Apache) will cause the control panel to stop functioning.
# Process Monitor
To access process monitor, click on the "Admin Tools" link followed by "Process Tools".
You will see a list of processes followed by detailed information as PID, USER, %CPU, %MEM and more. You can Authenticate to send signals to system, but you will need root password for that.
# Mail Queue Administration
To access mail queue administration, click on the "Admin Tools" link followed by "Mail Queue Administration".
You will see a list of mails in queue. You can choose to bounce, freeze, throw or delete selected messages. In order to do so select desired messages by clicking on the box in the left corner of the table and press desired action button.
# Brute Force Monitor
To accesss brute force monitor, click on the "Admin Tools" followed by "Brute Force Monitor" link.
From there you can see failed logins from IP addresses with detailed information such as login attempts, log entry, user and filter.
Since there is usually many failed logins, you can sort them out easy by IP, Usernames, Skin and Block lists. You may also show list of custom amount of bytes from the end of the file insead of the whole file.
# System Information
To access system information, sign into the control panel and then click on the "System Info & Files" icon, followed by the "System Information" link.

You can view additional information about system uptime, CPUs, memory usage and services.
# Log Viewer
To access log viewer click on the "System Info & Files" icon, followed by "Log viewer" link.
From there you will see all avaialbe log files, their location, size, for which process log was created. To view log, press "View" button at the top right corner of the table. You can either open whole log file in RAW format or you can select desired number of lines and even filter desired information using grep command.
# E-Mail Tracking
Go to "Admin tools" -> "E-mail tracking".
![]()
Fill in the input to narrow down the list of e-mails you wish to see and click "Search". Once you're done, this will display all the output directly below
![]()
# Need more help?
Please contact your hosting company for more assistance, or visit the DirectAdmin support forum at http://forum.directadmin.comopen in new window.
